Use extended statistics for correlated PostgreSQL columns
Guepard Team
November 14, 2026
PostgreSQL 18 scope. The SQL in this article was run on PostgreSQL 18.6 against synthetic fixtures.
Single-column statistics can describe each column accurately while describing their combination poorly. A service tier may almost determine a support queue. A warehouse code may determine a region. Multiplying independent selectivities in those situations can create a misleading estimate even after a fresh ANALYZE.
PostgreSQL extended statistics let the planner learn selected relationships inside one table. They are not a blanket instruction to use a particular plan, and creating the statistics object does not immediately populate it. The work starts by identifying which relationship a query needs.
Use a deliberately correlated fixture
The PostgreSQL 18 example below creates a support table where every enterprise ticket belongs to the priority queue and every standard ticket belongs to the general queue. The relationship is intentionally perfect to make the teaching question clear.
CREATE TABLE support_ticket (
  id bigint PRIMARY KEY,
  tier text NOT NULL,
  queue text NOT NULL,
  customer_id integer NOT NULL
);
INSERT INTO support_ticket
SELECT g,
       CASE WHEN g % 10 = 0 THEN 'enterprise' ELSE 'standard' END,
       CASE WHEN g % 10 = 0 THEN 'priority' ELSE 'general' END,
       g % 1000
FROM generate_series(1,100000) AS s(g);
ANALYZE support_ticket;

EXPLAIN (ANALYZE, TIMING OFF)
SELECT * FROM support_ticket
WHERE tier = 'enterprise' AND queue = 'priority';
On PostgreSQL 18.6 the planner estimated 996 rows against 10,000 actual: it multiplied two independent 10% selectivities. After creating the dependencies statistics below and analyzing, the same query was estimated at 9,903 rows. Record your own estimated and actual rows; the estimate is an observed result, not something to predict.
Match the statistic to the question
Functional dependencies describe how strongly values of one column determine values of another. They can help with supported equality-like conditions when treating the predicates as independent would underestimate matches. They do not enforce the relationship and should not replace a data constraint.
CREATE STATISTICS support_dependency (dependencies)
ON tier, queue FROM support_ticket;
ANALYZE support_ticket;

EXPLAIN (ANALYZE, TIMING OFF)
SELECT * FROM support_ticket
WHERE tier = 'enterprise' AND queue = 'priority';
This is an isolated experiment. To compare a different statistics kind, drop this object first in the lab so its effect does not overlap with the next one.
DROP STATISTICS support_dependency;
CREATE STATISTICS support_combinations (mcv)
ON tier, queue FROM support_ticket;
ANALYZE support_ticket;
A multivariate most-common-value list represents frequent value combinations. It can distinguish combinations that actually occur from combinations suggested by independent marginal distributions. Try both the expected combination and tier = 'enterprise' AND queue = 'general'. The latter is absent from this fixture. A statistics object still provides estimates rather than a semantic proof that the result is impossible.
For grouping, the question is different: how many groups will the combined columns produce?
CREATE STATISTICS support_group_count (ndistinct)
ON tier, queue FROM support_ticket;
ANALYZE support_ticket;

EXPLAIN (ANALYZE, TIMING OFF)
SELECT tier, queue, count(*)
FROM support_ticket
GROUP BY tier, queue;
ndistinct addresses combined distinct counts and can improve estimates for grouping. It is not the same mechanism as estimating a specific conjunction of filter values. An object can request multiple statistics kinds, but separate experiments make each kind's purpose easier to see.
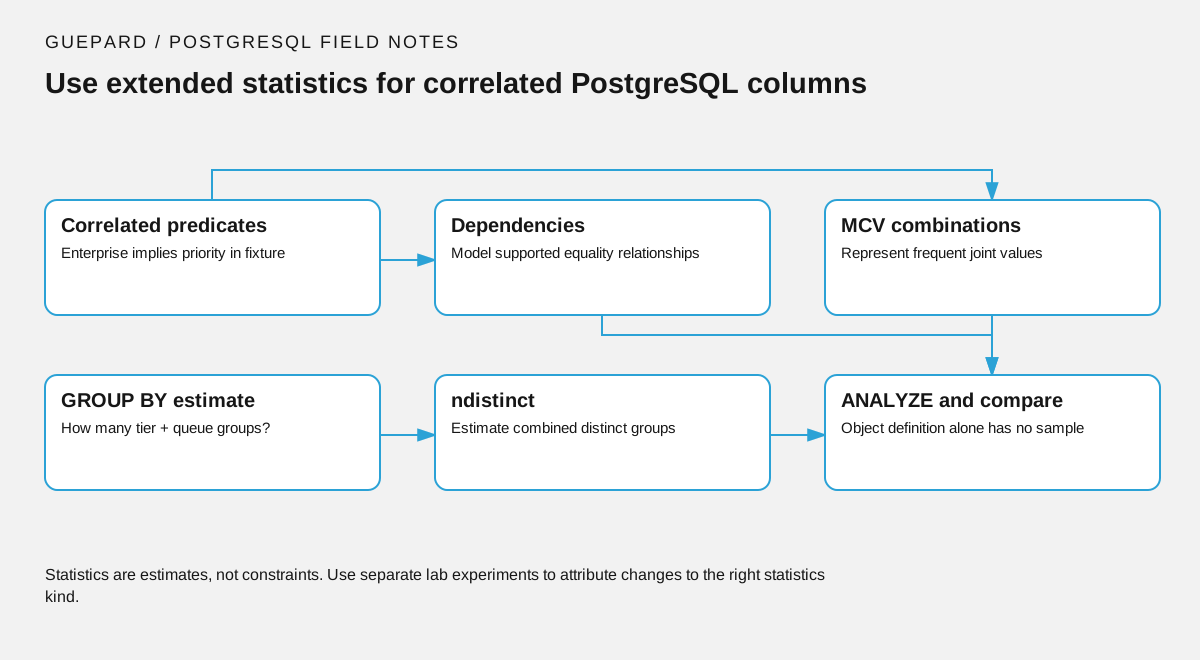
Reference decision map: dependencies model relationships, MCV models frequent combinations, and ndistinct models combined group counts.
Inspect what was collected
SELECT statistics_name, attnames, kinds,
       n_distinct, dependencies,
       most_common_vals, most_common_freqs
FROM pg_stats_ext
WHERE schemaname = 'public'
  AND tablename = 'support_ticket';
The view exposes the collected statistics subject to visibility rules. A newly declared object without a subsequent analyze is not a completed intervention. Record the analyze timestamp and the dataset state used to collect it.
Statistics collection consumes resources. Select columns that occur together in important queries and whose relationship is not captured adequately already. A large collection of speculative combinations can increase maintenance and planning work while making the tuning story harder to explain.
Understand the boundaries
Functional dependency statistics have supported clause forms; they are not a general theorem prover for arbitrary expressions, ranges, and joins. PostgreSQL 18 does not use extended statistics as a universal cross-table join-selectivity solution. If the error occurs only after joining two well-estimated inputs, investigate join keys, constraints, and the data relationship rather than assuming a same-table statistics object will solve it.
Data relationships can change. A new enterprise general-support workflow would weaken the perfect correlation in this fixture. Keep statistics fresh and test representative values after product changes. A statistic is a sample-informed model, not a business rule that rejects unexpected combinations.
Expression statistics can help when the repeated predicate is on a derived expression, but first establish that all callers use an equivalent expression. Slightly different casts, timezone choices, or functions can mean a different query contract. An expression index additionally supplies an access path; statistics alone do not.
Judge success by downstream decisions
A better row estimate is useful because it can improve join ordering, aggregation strategy, memory expectations, or scan selection. It may also leave the plan unchanged when the existing plan was already appropriate. Do not promise a speedup from the mere presence of a statistics object.
Compare estimates, plan shape, buffers, and execution behavior under a representative mix of predicates. Include rare combinations and values absent from the sample. Keep the source data and session settings constant during each comparison. If the only success criterion is that one plan line looks closer to an expected number, the experiment is too narrow to justify production rollout.
Sources and review scope
Guepard Team
Guepard Engineering

