Read PostgreSQL EXPLAIN ANALYZE without fooling yourself
Guepard Team
November 14, 2026
PostgreSQL 18 scope. The SQL in this article was run on PostgreSQL 18.6 against synthetic fixtures.
The most expensive mistake in plan analysis is interpreting a number before identifying what it measures. Planner costs are not milliseconds. A node's row count is not necessarily its total contribution across all loops. A shared-buffer hit is not free CPU work. An index scan is not automatically better than a sequential scan.
A plan is evidence about one execution under particular conditions. Start by recording those conditions, then follow the flow of rows from the leaves toward the result. Resist the urge to search for the largest printed number and call that the bottleneck.
Build a small, reproducible question
Use PostgreSQL 18 in a disposable database. The following fixture creates one hundred thousand orders distributed evenly across one hundred accounts. It is a teaching distribution, not a realistic production benchmark.
CREATE TABLE explain_order (
  id bigint PRIMARY KEY,
  account_id integer NOT NULL,
  total numeric(10,2) NOT NULL
);
INSERT INTO explain_order
SELECT g, g % 100, (g % 500)::numeric / 10
FROM generate_series(1,100000) AS s(g);
CREATE INDEX explain_order_account ON explain_order(account_id);
ANALYZE explain_order;

EXPLAIN (ANALYZE, BUFFERS, SETTINGS, TIMING OFF)
SELECT count(*), sum(total)
FROM explain_order
WHERE account_id = 42;
ANALYZE inside EXPLAIN executes the query. TIMING OFF removes per-node timing instrumentation while retaining execution-wide timing and row counts. It can reduce measurement overhead when the question concerns cardinality and I/O. It does not make the statement read-only; this example is read-only because its SQL is a SELECT without side-effecting functions.
Do not invent an expected scan type for this example. The selected plan depends on statistics, costs, table layout, and environment. The useful first observation is whether the estimated qualifying rows are in the same neighborhood as the observed rows.
Read one node at a time
For each node, ask what rows it consumes, what rows it emits, and how often it is invoked. In text output, actual rows and times for a repeatedly executed node are reported per loop as averages. Multiplying average rows by loops approximates its total row output, subject to rounding. This is particularly important for the inner side of a nested loop.
A scan can examine many tuples and emit few. Rows Removed by Filter helps explain that difference. An Index Cond narrows index access; a Filter applies after that access path has produced candidates. A predicate appearing somewhere in the plan does not mean the index used it to avoid reading candidates.
Parent node timing includes time spent in child execution, so summing every printed node duration double-counts work. Parallel plans add another layer: worker activity can overlap in wall-clock time. Analyze the plan tree and worker sections rather than treating the output as a flat expense ledger.
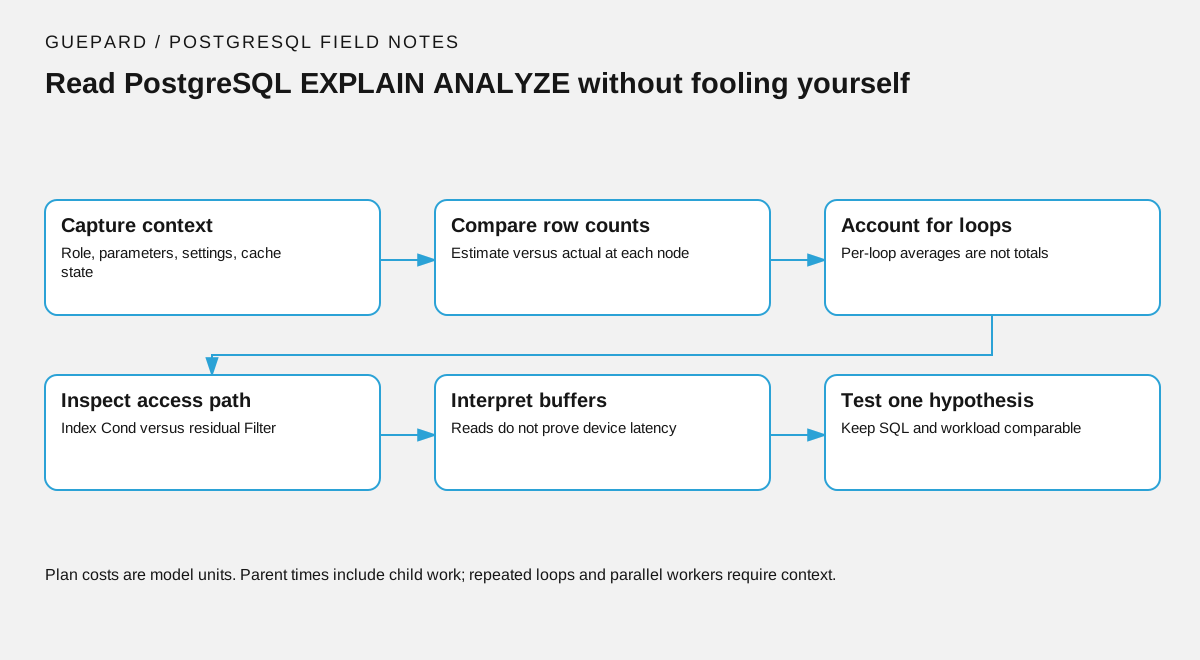
Reference plan-reading flow. Estimates describe the planner's model; actual rows and buffer counters describe the instrumented execution.
Separate buffer traffic from storage latency
BUFFERS reports block activity. A shared hit means a page was found in PostgreSQL's shared buffers. A shared read means PostgreSQL brought it into those buffers, but the operating system might already have cached the data. Neither counter alone proves a physical device read or its latency.
Repeated plan runs warm caches. Compare like with like, and describe whether the run is intended to represent a warm workload or a cold-start scenario. Do not flush a production server's caches to manufacture a benchmark. A controlled disposable environment is the appropriate place for invasive experiments.
Inspect temporary reads and writes separately from shared blocks. Temporary activity often points to sort or hash work that exceeded an operator's memory allowance. The fix might be less input, a different join, or narrower rows, rather than simply more memory.
Beware the measurement changing the workload
A count query may use an index-only path that the application's wider projection cannot use. A hand-written literal may receive a different plan from the application's prepared parameter. A query run as the table owner may differ from one executed under row-level security. Reproduce the actual projection, parameter types, role, and session settings before drawing conclusions.
For a machine-readable record, capture JSON output:
EXPLAIN (ANALYZE, BUFFERS, SETTINGS, FORMAT JSON, TIMING OFF)
SELECT id, total
FROM explain_order
WHERE account_id = 42
ORDER BY id
LIMIT 25;
This query intentionally differs from the aggregate. It asks for an ordered page, so startup cost and early termination matter. A node stopped by LIMIT may not consume all available input. Comparing its observed rows to an estimate for full execution without considering the limit can produce a false diagnosis.
Treat write plans as real writes
For UPDATE, DELETE, or INSERT, EXPLAIN ANALYZE performs the modification. A surrounding transaction followed by ROLLBACK can undo ordinary transactional changes, but sequences and external effects from functions or integrations may not be reversed. Triggers still execute, locks are still taken, and WAL or resource costs still occur. Use a disposable copy with side effects contained.
A reviewable conclusion names the evidence and the uncertainty: the filter discarded most candidates, the inner scan repeated many times, the estimate was wrong before a join, or the sort spilled in this run. It also names the next discriminating experiment. “The query needs an index” is a hypothesis; a plan comparison under the real workload is how that hypothesis earns credibility.
Sources and review scope
Guepard Team
Guepard Engineering

