Diagnose DuckDB Queries Before Tuning Threads
Guepard Team
November 13, 2026
Version scope: DuckDB 2.0. The SQL in this article was run on DuckDB 2.0.0 against small synthetic fixtures.
A slow query is a symptom, not a setting. Increasing the thread count before understanding the work can make a test harder to interpret. Start with a reproducible question: which part of this particular query consumes the resources that matter to the user?
Freeze a dataset and save the SQL. Record the engine version, memory budget, thread setting, storage location and result size. Also state whether the task is interactive analysis, a scheduled report or a full export. The same elapsed time can be acceptable for one and disruptive for another.
Separate the plan from the execution
DuckDB's EXPLAIN displays a plan; EXPLAIN ANALYZE executes the statement and adds runtime information. Use the executing variant only when running the statement is safe. Never attach it casually to an expensive production operation or a statement with side effects. DuckDB profiling documentation
Here is a diagnostic example. It assumes disposable orders and customers tables with documented keys.
EXPLAIN ANALYZE
SELECT c.region, sum(o.amount_minor) AS total_minor
FROM orders o
JOIN customers c ON c.customer_id = o.customer_id
WHERE o.business_date >= DATE '2026-10-01'
  AND o.business_date < DATE '2026-11-01'
GROUP BY c.region;
Read the plan from data access toward the result. Ask how much input reaches each operator, whether the join expands rows and whether expensive work happens before a selective condition. Preserve the complete plan, not only a screenshot of the slowest-looking line.
Check cardinality before optimizing arithmetic
Suppose the report is unexpectedly expensive because a supposedly unique customer key appears several times. The join can multiply both work and reported revenue. A faster version of that query would still be wrong.
Run a key check before comparing settings:
SELECT customer_id, count(*) AS copies
FROM customers
GROUP BY customer_id
HAVING count(*) > 1;
If the table intentionally contains history, the correct solution is a temporal join or an explicit current-row rule. Deleting duplicate-looking rows without understanding their meaning may destroy valid history.
Then check the reporting population. How many orders survive the date condition? How many lack a matching customer? Is excluding them intended? A change from an inner join to a left join changes the contract and must be reviewed as a semantic change.
Change one variable and preserve the evidence
After correctness is established, pick one hypothesis: excessive input width, an unnecessary repeated transformation, a resource constraint or a join that produces a large intermediate result. Change only the part that tests that hypothesis. Keep both plans and compare results as well as runtime.
For grouped totals, compare keys and values in both directions. Equal row counts alone cannot establish equality. For floating-point calculations, define a tolerance appropriate to the business question rather than pretending every parallel reduction must have identical binary output.
Measure end-to-end behavior separately. A client that renders a million result rows can dominate perceived latency even when execution is short. Record fetch and serialization cost where they matter. Avoid adding operator times mechanically when execution overlaps.
Stop when the evidence is sufficient
A useful tuning report names the hypothesis, input snapshot, change, correctness check and measured result. If the result is inconclusive, say so. This article supplies a procedure, not a performance claim.
The fastest route to a dependable improvement is often a better diagnosis: reduce work that should never have happened, then tune the work that remains.
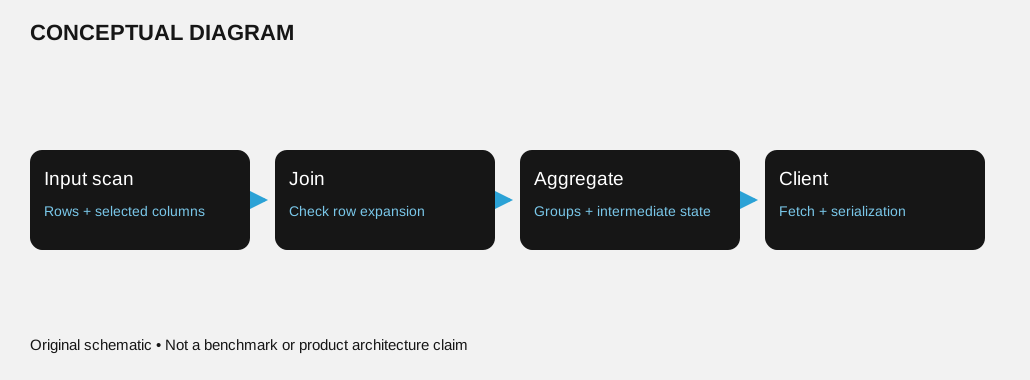
Inspect each stage and verify semantics before changing resource settings. This is a conceptual plan, not a measured profile.
Guepard Team
Guepard Engineering

